
Greenhouse gas reporting under the Climate Change Act
Calculate your emissions from the records you already keep
Upload your activity data — fuel purchased, electricity consumed, waste disposed. The calculator classifies each record against international categories, applies published emission factors, and produces an inventory your organisation reviews before anything is made public.
How it works
Watch one spreadsheet become an emissions figure
A fleet fuel export moving through the four stages the calculator puts it through. It runs on its own — pause it, or step through at your own pace.
Runningfleet-fuel-2025.csv
The export you already produce
A fleet fuel report straight out of finance. No template to fill in, no columns to rename first.
9 columns · 8,592 rows
What you get
An inventory, and a public record
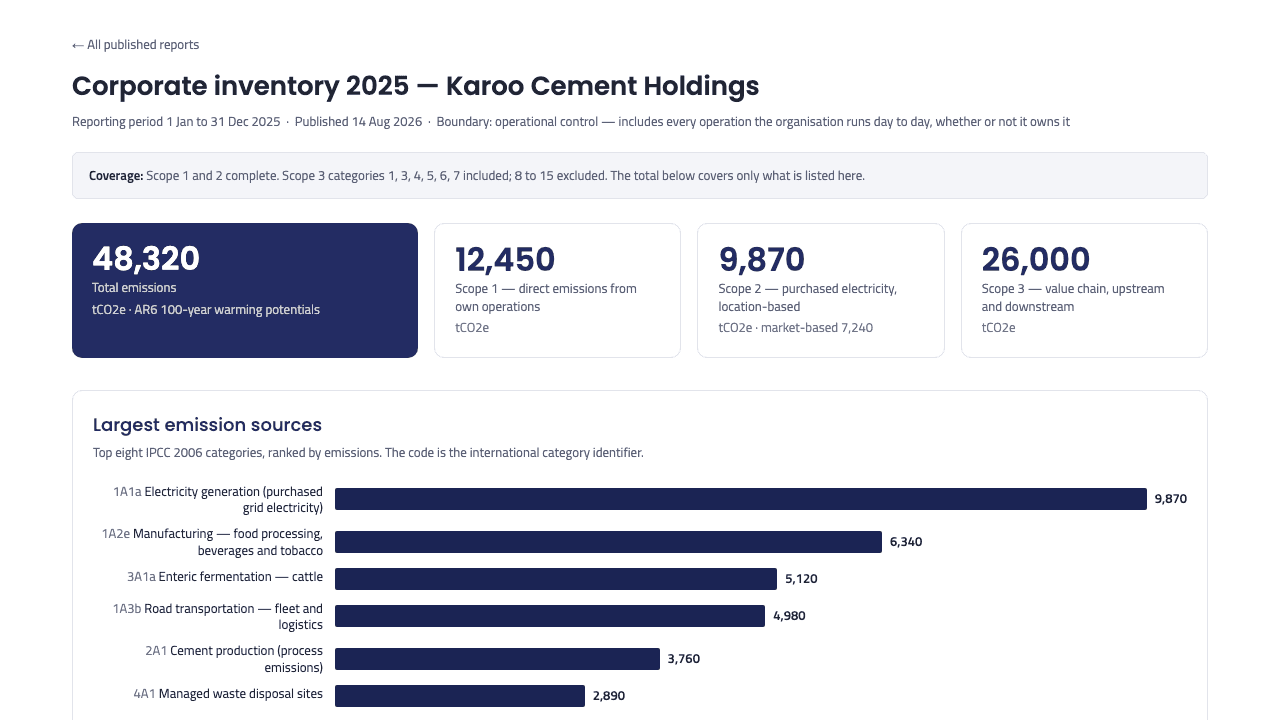
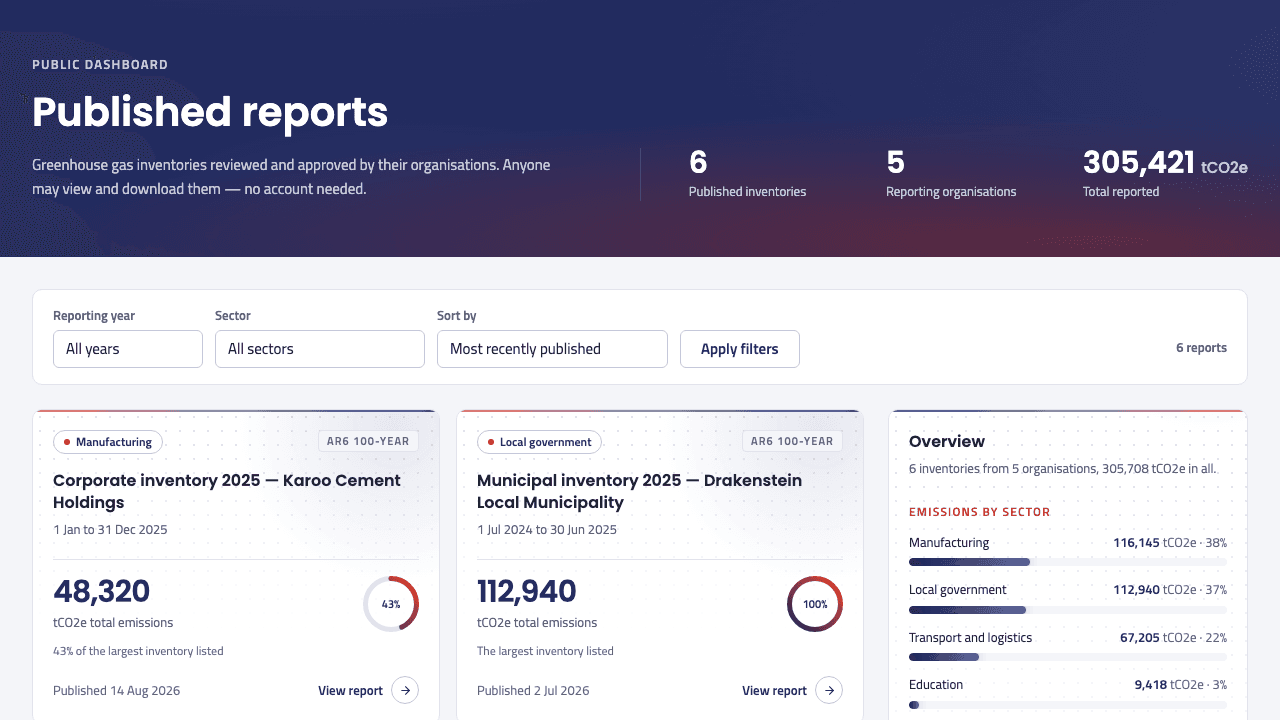
Where the calculation lands: the report your organisation reviews, and the page anyone can read once you publish it.
The output
An inventory an auditor can follow
One total, split by scope, with every record filed under an IPCC 2006 code and every figure citing the emission factor that produced it. Scope 2 is reported on both bases, and only one of them enters the total.
- Location-based and market-based side by side, never double counted
- Every chart ships the same numbers as a data table
- A CSV carrying every figure, scope split and category on the page
The public record
Published, it becomes something anyone can cite
Published inventories sit on a dashboard that needs no account. Filter by year and sector, open any organisation's report, and download the figures behind it.
- No sign-in, so a regulator or journalist can check the number themselves
- A permanent link per report, safe to cite
- Withdrawn reports keep their link and carry a public notice explaining why
What you upload
Activity data is what you already record
Grouped by the scope each one lands in, with the unit it is measured in and the document it usually comes out of — so you can tell at a glance what you already hold.
Scope 1
Burned or released by your own operations.
Fuel purchased
Diesel, petrol, LPG and coal, whether it went into a vehicle, a boiler or a generator.
- Measured in
- Litres or kg
- Usually found in
- Fleet cards, delivery notes, the general ledger
Refrigerants and process emissions
Air-conditioning top-ups, and industrial outputs such as cement clinker. Converted using AR6 warming potentials.
- Measured in
- kg of gas, tonnes of output
- Usually found in
- F-gas service records, production logs
Scope 2
Energy you buy and consume.
Electricity consumed
Reported on both a location-based and a market-based basis. Only one of the two enters your total.
- Measured in
- kWh
- Usually found in
- Meter readings, utility invoices
Scope 3
Everything upstream and downstream of you.
Waste disposed
Landfill, recycling or incineration, split by waste stream and destination.
- Measured in
- Tonnes, by stream
- Usually found in
- Waste transfer notes, contractor invoices
Goods and services bought
Quantities where you have them, spend where you do not. Spend-based rows are flagged as the least precise.
- Measured in
- Quantity, or spend
- Usually found in
- Purchase ledger, accounts payable
Business travel and logistics
Road, air and freight, mapped to published transport factors.
- Measured in
- km, or litres
- Usually found in
- Expense claims, freight invoices
Why it can be trusted
A published figure is a public record, and is treated like one
These are not settings. They are rules the system enforces on the server, whatever the interface happens to show.
Nothing publishes itself
A person reviews every inventory and must acknowledge each outstanding warning before the publish button will do anything. The rule is enforced on the server, not just in the interface.
Errors cannot be waved through
Rows that cannot be calculated — an unmatched code, a missing quantity — must be fixed or explicitly excluded. Acknowledging them is not enough.
Nothing is deleted quietly
Excluded rows stay in your file and in the report's audit trail. Only an unpublished draft can be deleted at all.
Published figures are permanent
A published inventory is an immutable snapshot. It can be unpublished, or withdrawn with a public notice explaining why — but it can never be silently changed.
Accounts are approved by hand
A super user reviews every administrator request. Signing in is not the same as being allowed in.
Every figure cites its source
Each calculation records the exact emission factor, its publisher and its version, so any number can be traced back to the method that produced it.
Questions
The things people ask first
Do I need my data in a particular format?
No. Upload the CSV or Excel you already have and the calculator proposes how each column maps — activity date, quantity, unit, facility and so on. You confirm anything it is unsure about, and the mapping is remembered for future uploads from the same source.
Where do the emission factors come from?
Published sources — IPCC 2006 defaults, the Eskom grid factor for purchased electricity, DEFRA for transport fuels, and supplier-specific factors where you have them. Every calculation records which factor and which version it used.
Why do some reports use AR5 and others AR6?
Global warming potentials are revised between IPCC assessment reports. Each inventory is stamped with the set it was calculated against, so an older report stays true to the science of its time rather than shifting under you.
Report for your organisation
Register as an administrator to upload data and produce an inventory. Accounts are approved manually by a super user, so allow a working day before your first sign-in.